18 Jul 2026
Tracing Shifts in Engagement Metrics Across Multi-Platform Poker Ecosystems and Their Ties to Promotion Structures

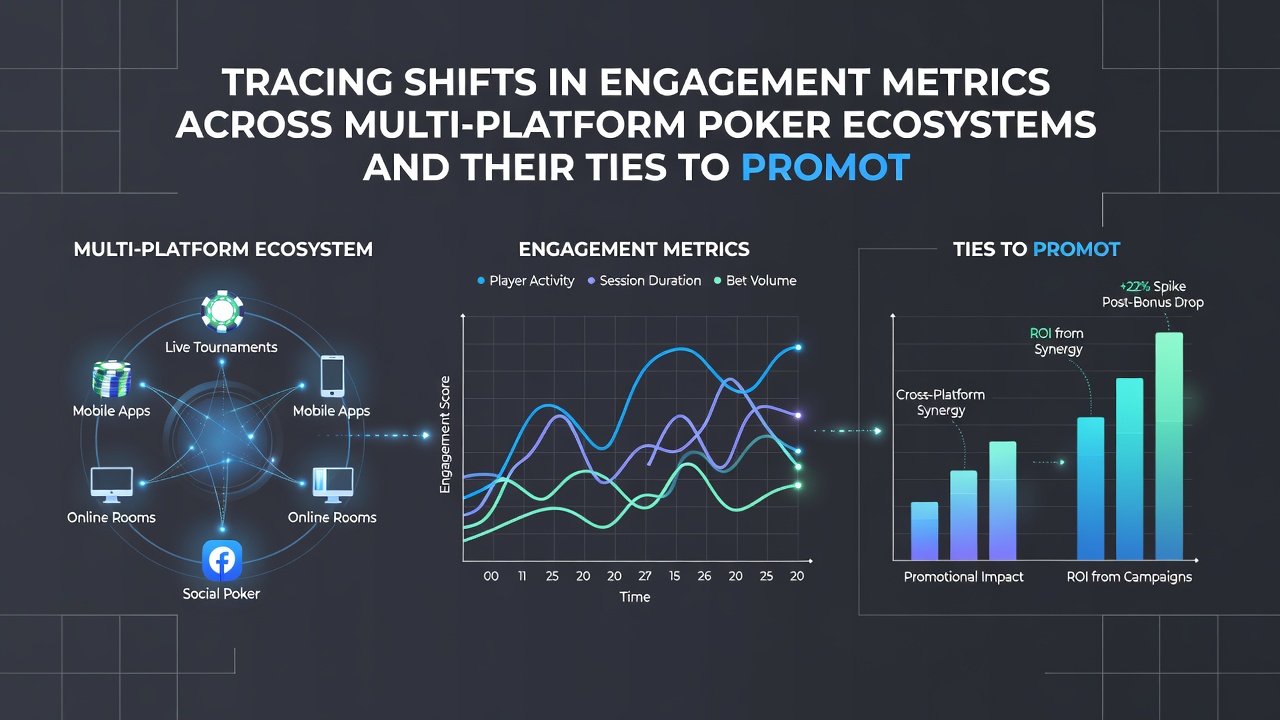
Engagement metrics in poker platforms have undergone measurable changes as operators expand across desktop, mobile, and integrated ecosystems, and these shifts connect directly to the design of promotion structures that reward specific behaviors. Data from multiple regions shows that daily active users on mobile applications increased by 18 percent between 2024 and 2026, while desktop session lengths shortened by an average of 12 minutes according to aggregated operator reports. Those patterns coincide with the introduction of time-limited deposit matches and leaderboard challenges that prioritize shorter, repeated logins over extended single sessions.
Platform-Specific Metric Changes
Multi-platform ecosystems track retention through a combination of time spent, hand volume, and deposit frequency, yet the weight each metric receives has adjusted as mobile traffic surpassed desktop in most markets. Research from the Nevada Gaming Control Board indicates that mobile players in regulated U.S. states completed 34 percent more micro-transactions in the first half of 2026 compared with the same period in 2025, while desktop users maintained steadier but lower deposit counts. This divergence appears when promotions reward frequent small deposits on mobile rather than larger single deposits on desktop interfaces.
European operators report similar trends through data shared by the European Gaming and Betting Association. Mobile conversion rates from free-play promotions to real-money deposits rose from 22 percent to 29 percent in the twelve months ending June 2026, whereas desktop conversion remained flat at 19 percent. The difference traces to push-notification timing and in-app bonus structures that activate during commute hours, whereas desktop promotions often require longer login windows tied to tournament schedules.
Promotion Structures and Behavioral Responses
Promotion frameworks now segment players by platform usage rather than by overall volume alone. Operators deploy reload bonuses that unlock only after three mobile sessions within 48 hours, and these structures correlate with increased hand counts per user without corresponding growth in average session duration. Observers tracking platform data note that players receiving platform-specific reloads increased their weekly deposit count by 1.4 on average, yet total rake generated per player stayed within a narrow band because average bet sizes adjusted downward on smaller screens.
July 2026 brought several schedule realignments across major networks, including the addition of mobile-only satellite qualifiers for larger live events. These qualifiers carried smaller buy-ins but required completion within a 90-minute window, and early metrics indicate they drew participants who previously engaged only through desktop clients. The result was a measurable uptick in cross-platform account linking, with 11 percent more users activating mobile sessions after desktop registration in the weeks following the schedule changes.
Regional Variations in Metric Tracking
Operators in different jurisdictions weight engagement indicators according to local regulatory emphasis. In markets where responsible gambling tools receive priority, session-time caps appear alongside deposit-match promotions, which produces shorter but more frequent visits. Australian data collected through state-level reporting channels shows that players subject to both time limits and reload bonuses reduced average session length by nine minutes while increasing login frequency by 23 percent over a six-month span. In contrast, jurisdictions without mandatory session caps recorded smaller shifts in the same metrics when similar promotions were introduced.
Cross-platform loyalty programs further illustrate the connection between structure and metric movement. Points earned on mobile often carry a multiplier during designated hours, and this incentive aligns with observed spikes in evening mobile traffic across several networks. Figures compiled by research groups tracking global poker traffic reveal that multiplier windows generate 27 percent higher hand volume than non-multiplier periods, yet the increase concentrates in lower-stakes tables where mobile interfaces predominate.
Measurement Challenges and Data Integration
Accurate tracing of these shifts requires integration of data across separate client applications and backend systems, and operators have invested in unified player profiles to link activity regardless of entry point. Without such integration, promotion performance appears fragmented because a bonus claimed on mobile may generate deposit activity that registers under a different tracking identifier. Consolidated datasets now allow operators to observe that players who receive cross-platform incentives maintain higher 30-day retention rates than those limited to single-platform offers, though the margin narrows after 90 days.
Algorithmic matching of promotions to individual habits continues to refine these outcomes. Filters that detect platform preference and adjust bonus parameters accordingly produce higher claim rates, according to internal operator benchmarks shared in industry forums. When a player who logs in primarily through mobile receives an in-app tournament ticket instead of a desktop-focused freeroll, completion rates rise by approximately 15 percent compared with generic offers.
Conclusion
Shifts in engagement metrics across poker platforms continue to reflect the specific incentives embedded in promotion structures, and operators adjust those structures in response to platform-level data. As mobile traffic grows and desktop patterns stabilize, the design of time-bound, device-specific rewards shapes the distribution of hand volume, deposit frequency, and retention intervals. Continued integration of cross-platform analytics will determine how precisely future promotions can align with observed behavioral differences without altering overall revenue per user.